Dashboards
Find our new infographics and data visualizations below.
Idaho Voter Explorer
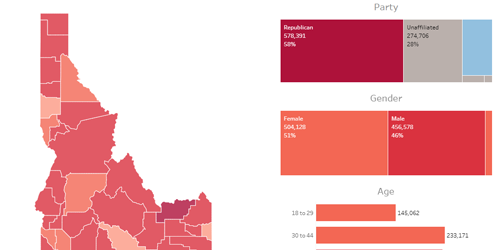
This data visualization displays voter data in Idaho.
Explore Idaho voter data with the following views:
- Party breakdowns
- Gender breakdowns
- Age ranges
- Drill down to County, Legislative District, and even City views
Voters Moving to Idaho
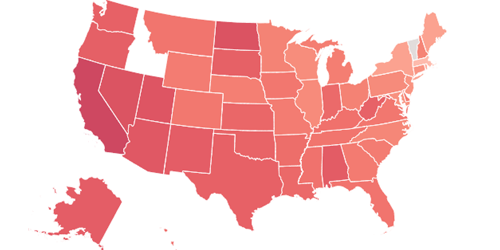
This data visualization displays party information for voters who have moved from out of state and are now registered to vote in Idaho.
Explore the dashboard with the following views:
- Party affiliation breakdown by state
- Click on a state for individual city information
- Open the menu for age breakdowns and total voters moved
Absentee Ballot Tracking
This data visualization displays absentee ballot statistics for the November 7 election in Idaho.
Explore the data by county or for the entire state with the following views:
- Bar chart of eligible voter percentage
- Absentee ballots issued
- Rate of return
- Absentee ballots requested by party
Campaign Finance
This data visualization displays campaign finance data for mayoral and city council races in Idaho.
Explore contribution and expenditure data with the following views:
- Bar chart of candidate totals
- Map of totals by city
- Timeline by office or candidate
- Amounts by unique contributors
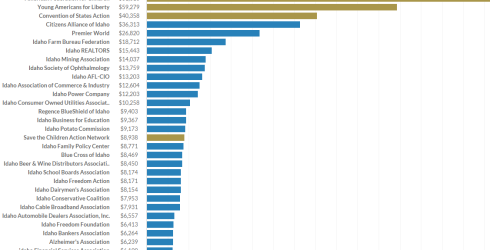
Lobbying
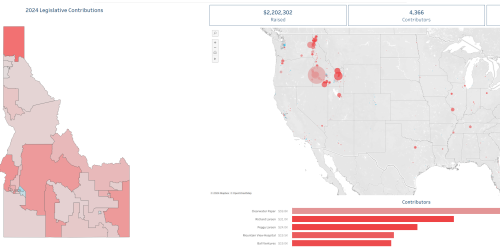
Curious about in-state and out-of-state lobbying? This is the viz you are looking for!
Explore lobbying data with the following views:
- Bar chart of lobbying totals
- Map of companies by city
- Lobbyist names and companies represented
- Lobbyist subjects and expense types
Business Economic Report
This data visualization displays information regarding businesses in Idaho.
Explore the data with the following views:
- New Businesses by Type
- Businesses in Good Standing
- Inactivated Businesses
- Trademark Registrations
